
 spacestrategies.org

Key Findings
- Total global underwriting capacity is roughly $550M–$700M per year against about $23B of insured assets in orbit. One large geostationary loss near $445M can therefore consume nearly a full year of market premium.
- Fewer than 1% of active low-Earth-orbit satellites carry in-orbit cover. Of roughly 10,000 active spacecraft, only about 300 hold comprehensive policies. SpaceX self-insures Starlink, which alone is 74–79% of all active spacecraft.
- The 2023 loss year ran a roughly 180% loss ratio — about $557M premium against about $995M claims. Losses near $2B across 2023–24 forced repricing of 50–150%, the steepest rates since the early 2000s.
- Well under 100 senior space underwriters work worldwide, and named carriers (Brit, Hiscox, Volante, Canopius) exited or ran off in 2023–24. The market consolidates by distress attrition rather than acquisition.
- The annual premium pool ($500M–$1B) is roughly an order of magnitude below the headline “market value” forecast ($4.06B in 2025 rising to a projected $6.23B by 2030). The two are routinely, and wrongly, conflated.
Sources and evidence strength for every figure above: see the Key Figures table at the end.
Executive Summary
This analysis examines the structure, capacity and competitive dynamics of the commercial space risk-transfer market as the satellite population shifts decisively toward low-orbit mega-constellations. The market is structurally unattractive and getting more so, because its fastest-growing customer segment has rationally chosen not to buy at all. For incumbents, the question is no longer how to price space risk. It is whether the dominant risks can be modelled and attributed in the first place — which moves the whole contest from pricing to insurability.
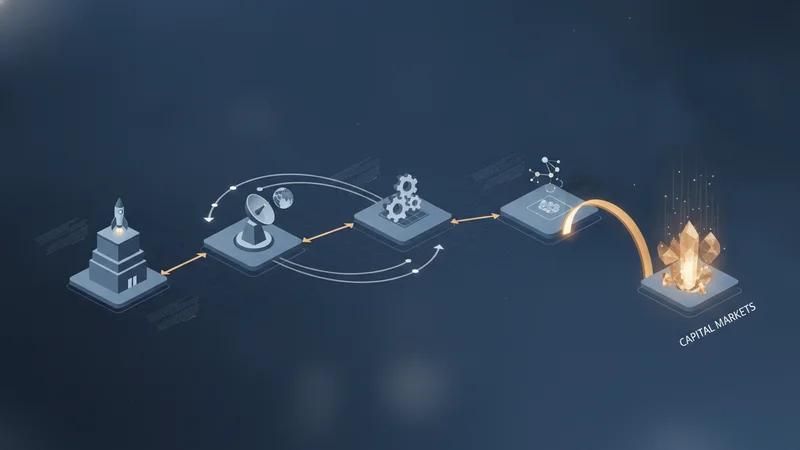
The Industry
Space insurance is a tiny, concentrated market asked to stand behind an asset base orders of magnitude larger than the capital it can deploy — and its single most important customer has decided it does not need the product. That combination, rather than any conventional supply-and-demand story, defines the sector’s competitive character.
Context and Industry Definition
The scope here is commercial space risk-transfer: launch insurance, in-orbit satellite property cover, third-party and debris liability, and the emerging parametric and blanket-constellation products. Behind these sit the reinsurance and alternative-capital machinery — captives, sidecars, insurance-linked securities. The market is global, with the London and Lloyd’s market as its pre-eminent underwriting hub. It segments roughly into launch (about 35–40% of premium), in-orbit, third-party liability, and the nascent parametric line.
One boundary choice does the heavy lifting. Operator self-insurance and redundancy are treated here as a competitive force inside the market, not as out-of-scope non-demand — because the topic’s central dynamic is invisible otherwise. A second discipline matters just as much. “Market value” (a forecaster’s aggregate-revenue base, around $4–6B) is never conflated with the premium pool underwriters actually collect ($500M–$1B) or with deployable capacity ($550M–$700M per year). These differ by roughly an order of magnitude, and reading the first as the third is the canonical error this market invites.
The Competitive Landscape
Begin with the force that ordinarily matters least and here matters most: the threat of substitutes. The substitute is not a rival product. It is the customer’s decision not to buy, and at constellation scale that decision is rational. A roughly $400,000 Starlink satellite cannot justify a premium at 1–3% of its value , so expected loss per unit falls below the commercial premium and redundancy becomes the economically correct hedge. The dominant operator already behaves this way: SpaceX does not insure Starlink in orbit, and Starlink is 74–79% of all active spacecraft. NASA never fully insured the ISS , a precedent worth more than $75B. So the least-insured population is also the largest and the fastest-growing. The substitute is not marginal leakage but a redefinition of the addressable market.
That single fact reshapes the others. Buyer power is sharply bifurcated. Large constellation operators hold high power precisely because their best alternative is walking away. Geostationary and debt-financed operators hold low power because financiers compel cover. The growth segment is the high-power segment, so aggregate buyer power is rising — even though most space buyers, by count, remain captive. The penetration paradox follows directly. The in-orbit line grows fast in insured-asset value yet barely at all in premium, because the value accrues in exactly the orbits that decline to insure.
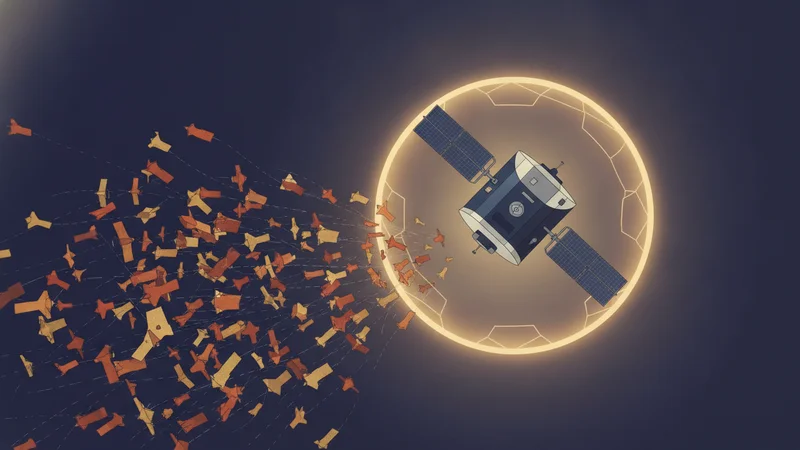
The segmentation makes that paradox concrete. Launch remains the mature cornerstone at roughly 35–40% of premium, repricing slowly as reusability splits the book: flight-proven Falcon 9 boosters at about 98% success push rates down, while unproven vehicles carry a premium. In-orbit cover is the fastest-growing line in headline value yet the thinnest in penetration. Third-party and debris liability is often regulation-mandated but has never processed an attributed collision claim, so it is latent rather than active. Parametric and blanket-constellation products are the emerging frontier, and their eventual size is uncertain. None of this should be read off the widely quoted market-value forecast , which projects $4.06B in 2025 toward $6.23B by 2030 at a 9.1% compound rate. That figure is a forecaster’s aggregate-revenue base. The premium underwriters actually collect is roughly a tenth of it, which is why confusing the two overstates the actionable opportunity so badly.
Rivalry, by contrast, is intense but cyclical rather than a steady-state price war. In soft years a concentrated set of carriers competes on rate over a premium pool of only $500M–$1B; loss shocks reset the cycle abruptly. Two such shocks dominate the recent record. In 2023, insurers collected about $557M and paid about $995M — a loss ratio near 180%, driven by named losses including ViaSat-3 (about $445M), SES O3b mPower (about $472M) and Inmarsat-6 F2 (about $348M). Then in January 2026 the SpainSat NG II military satellite , insured near $400M, became a likely total loss from a particle impact, reversing a softening market in a single event. Capacity does not gently adjust to such years; it flees. Brit, which had led a space consortium for more than 25 years with over $50M of capacity, exited entirely. Canopius went into run-off. Hiscox and Volante left. Allianz, AIG, Swiss Re and Munich Re cut exposure — repeating a pattern from the 2018–19 shock, when AIG, Allianz and Swiss Re had already temporarily shuttered space portfolios.
Supplier power and the threat of new entrants are two faces of one constraint. The binding supplier is capacity itself, plus the talent and data that decide what can be written, and that capacity is a hard ceiling of roughly $550M–$700M against the $23B it nominally covers. When reinsurers and retrocessionaires withdraw, the primary market cannot fill the gap, and single-spacecraft capacity tops out near $500M–$600M — far short of the multi-billion-dollar private infrastructure now being launched. Entry, meanwhile, is gated not by capital but by people and epistemics. Industry estimates put senior space underwriters worldwide at well under a hundred , and modelling correlated, sparse space risk is its own barrier. Machine-learning actuarial engines exist and are maturing, but they are data-hungry, and space’s thin loss history starves them — which keeps pricing artisanal. So new “entrants” are almost always re-formed teams of existing experts (Hive from ex-Occam talent, Phemis from ex-Hiscox, Aesir from ex-Volante, Whitecap): capital chasing the same small book the moment rates harden. Lloyd’s market-wide data, used here only as backdrop, shows recent startups clustering in the bottom performance quartile, which suggests many of these re-formations will not survive the next soft cycle.
The disruption lens shows why this is durable rather than a passing dislocation. Self-insurance is not merely cheaper indemnity. It competes on a new value attribute — redundancy instead of payout — and it passes every test of genuine disruption: worse on the traditional metric (no indemnity at all), far cheaper at scale, and aimed squarely at customers the incumbent product overserves or cannot profitably reach. In unit terms the disruptor has already reached the mainstream. The incumbent’s non-response is rational, not negligent: the disrupted LEO segment is unprofitable to insure conventionally, so carriers decline it, which is exactly the gap self-insurance fills. The deeper implication is that reaching back down requires a different product entirely. As Andrew Bonwick, product-development VP at Relm Insurance, has put it , once you start trying to insure individual satellites you are looking at the wrong thing; the economic unit is the constellation or the business, not the spacecraft. That points toward business-interruption and fleet logic rather than per-asset indemnity. The one credible reversal channel is financial, not technical. SpaceX’s S-1 discloses roughly $29B of consolidated debt, including a bridge loan near $20B due in December 2026, and debt covenants can pull self-insured risk back toward demonstrable transfer. That counter-thesis is real but inferential.
Five Forces Summary
| Force | Intensity | Key Driver | Trend |
|---|---|---|---|
| Competitive Rivalry | High | Tiny premium pool plus hard-market cycle volatility | Increasing |
| Threat of New Entrants | Low-Medium | Talent and modelability barriers gate entry | Stable |
| Threat of Substitutes | High | Self-insurance and redundancy at constellation scale | Increasing |
| Supplier Power | High | Capacity ceiling plus scarce underwriting talent | Increasing |
| Buyer Power | Medium (bifurcated) | Constellation walk-away versus geostationary covenant-binding | Increasing |
Overall Industry Attractiveness: Unattractive

The Value Dynamics
If the external forces explain why the market is hard to compete in, the internal value chain explains why competing on the old basis is increasingly futile. Value is draining out of the activity the industry was built around — raw indemnity capacity — and pooling instead in two places it has historically undervalued: the ability to model risk and the ability to attribute loss.
Where Value Lives
The decisive activities in this chain are underwriting and modelling on the production side, and claims attribution on the settlement side. Both are weak-to-average, and for the same reason: they share one epistemic problem. Can the risk, and the cause of the loss, actually be determined? Sparse loss data starves the modelling engines. Correlated losses violate the independence assumption that risk-pooling depends on. A debris-generating collision raises risk for every satellite in the same orbital shell at once — the kryptonite of insurance economics. And the correlation is not only external. Collision-avoidance manoeuvres within a mega-constellation can themselves cascade, and the pairwise avoidance paradigm is inherently unstable at fleet scale; Starlink alone performed on the order of 300,000 such manoeuvres in 2025. Traditional per-satellite models capture none of this fleet-level correlation, which is one more reason the underwriting frontier is moving toward aggregate constellation policies.
The attribution problem is starker still. Roughly $750M of recent losses — the Inmarsat-6 F2 and SpainSat cases — were caused by particle strikes of undetermined origin, man-made debris or micrometeoroid. (That dollar tally rests on a single analyst’s figures and is load-bearing, so it is flagged rather than asserted flatly.) The in-orbit third-party liability line has never processed a single formally attributed collision claim — a point made by more than one industry observer. The peril baseline is authoritative and worsening. ESA’s space-environment health index sits at 4 against a sustainability threshold of 1, and orbit holds something like 50,000 objects larger than 10cm and well over a million larger than 1cm — the latter populations largely untrackable yet lethal. That is precisely what makes causation, and therefore liability pricing, intractable.
Against that, the one genuinely strong link is positional, not risk-bearing. The London and Lloyd’s hub owns distribution, broker relationships and lead-underwriter placement, supported by mature institutional plumbing — including the London Bridge 2 protected cell company built to attract alternative capital. But distribution strength is a moat around a shrinking pool, not a claim on the value that is migrating.
And it is migrating, in two directions at once. First, away from indemnity capacity and toward whoever can price the unmodellable through parametric triggers and discipline operator behaviour through data-sharing incentives. By 2024, more than 40% of LEO operators were reported to have adopted blanket policies covering ten or more satellites per contract (a single-source figure, treated as directional). Lloyd’s and AXA XL have piloted deductible waivers for operators who share real-time tracking data with the Space Force’s Unified Data Library, treating a tracked-debris strike as no-fault. In-orbit servicing adds a further lever: vehicles that can repair rather than replace, and operator design choices that lower collision exposure, open the door to risk-engineering credits analogous to terrestrial safety systems. Second, capital is migrating toward structures that bypass the capacity ceiling entirely. Captives, sidecars and insurance-linked securities are the credible new-capacity channel, though the magnitude evidence — reserves ceded to sidecars nearly tripling toward $55B — is industry-wide and applied to space only by analogy.
The chokepoints make the power map explicit. Two control points dominate today. The first is aggregate capacity, the hard ceiling. The second is lead-underwriter consent, the quiet veto whereby a risk becomes uninsurable at any sensible price once two or three London leads decline it. A third is emerging: modelling and space-situational-awareness capability, which increasingly decides what is writable at all. The widest gap between value created and value captured sits in attribution. Enormous value is at stake, but no actor monetises it, because causation cannot be established. Whoever solves attribution — through forensic tracking or codified conduct standards — would unlock a new value pool and, in the same motion, trigger a radical repricing.
Competitive Position
The dual-lens payoff is uncomfortable: the industry is well-defended against the wrong threat and exposed to the right one. The talent and modelability barriers that keep new capital out give incumbents a defensible position, but that same barrier is useless against the substitute, because operators who self-insure need no one to underwrite them. The structural advantage — the London institutional moat and scarce talent — sits in distribution and infrastructure. The structural vulnerability — substitute erosion plus the capacity ceiling plus unattributable correlated loss — sits in the risk-bearing core. Advantage and vulnerability do not converge. The moat protects a shrinking castle, and the medium-term viability of the incumbent book rests on the geostationary, launch and debt-financed assets where buyer power stays low because covenants compel cover.
There is a further twist that turns a market problem into a systemic one. A few London leads can render a venture uninsurable, and uninsurability is self-reinforcing: more debris raises costs, which thins coverage, which leaves more unaccountable actors generating more debris. So insurance increasingly functions as a de facto gatekeeper of which space ventures get financed at all . Where governance frameworks have stalled, behaviour-sensitive pricing has quietly made underwriters the nearest thing orbit has to a regulator. That is an opportunity for whoever builds the capability, and a concentration risk for everyone else, since the endpoint is a market only the heavily capitalised or state-backed can access.

The Outlook
The structure points to a single strategic conclusion. The incumbent product cannot be defended on its old terms for the orbits that are growing, and the energy of the market now lives at the product frontier and the capital frontier — where the sector is trying to escape its own capacity ceiling.
Strategic Implications
Industry positioning. Stop defending per-satellite indemnity for LEO, which is structurally unprofitable, and reposition around the constellation or the business as the insured unit — with business-interruption and professional-indemnity logic rather than spacecraft-by-spacecraft cover. Lean into behaviour-linked pricing that makes insurers de facto regulators of orbital discipline, the enforcement role that governance frameworks have failed to fill. Hold the geostationary, launch and financed core, where buyer power is low and the indemnity model still works.
Value chain focus. Invest in the activities where value is migrating: space-situational-awareness-integrated modelling, parametric trigger design, and the attribution and forensics capability that is currently an unmonetised leak. Treat parametric and blanket products, plus risk-engineering credits for servicing and debris-mitigation features, as the sustaining response to the self-insurance disruptor rather than a defence of the old product. Pursue alternative capital (insurance-linked securities, sidecars, protected cell companies) to grow capacity rather than competing for a share of the same thin premium pool. Treat the Lloyd’s hub as a distribution asset, not a risk-bearing edge.
What to monitor. Four indicators carry disproportionate signal. First, the first successfully attributed debris-collision claim — a latent systemic trigger that would reprice the liability line overnight. Second, large-operator covenant behaviour around the December 2026 bridge-loan maturity, the strongest test of whether financing pulls self-insured risk back toward transfer. Third, capacity flows after the SpainSat reversal, which will reveal whether the cycle is hardening again. Fourth, Kessler-cascade and orbital-congestion indicators — one widely cited “CRASH clock ” compressed from 164 days in 2018 to 5.5 days in 2025 — the correlated tail risk that aggregate capacity cannot absorb. A fifth, slower signal worth watching is the unpriced externality: light-pollution and sustainability pressure that could, over time, expand the insurable and liability perimeter through ESG and regulatory channels.
Limitations
Treating self-insurance as an in-scope substitute makes the disruption visible but renders “market size” inherently ambiguous: a narrower premium-only boundary understates the dynamic, a broader asset-value boundary overstates the market. Several load-bearing inputs are single-source, notably the $23B insured-asset figure underpinning the capacity-to-exposure ratio, the reported blanket-policy adoption above 40%, the roughly $750M attributed-loss tally, and the estimate of well under 100 senior underwriters; the related claim that no collision has ever been formally attributed is, by contrast, corroborated across more than one source. Porter’s framework is point-in-time, but this market’s defining feature is its cycle, so any single force rating is a snapshot that swings with the loss calendar — supplier power and rivalry most of all. Finally, the disruption reading assumes self-insurance economics persist; the debt-covenant counter-thesis or a major correlated-loss shock could reverse it, and the alternative-capital scaling argument rests on industry-wide figures applied to space by analogy.
Key Figures — Sources & Evidence
Every load-bearing number in this analysis, with its source and how strongly the research corpus supports it. “Single source” means the figure rests on one outlet or estimate — directional, not settled. The first four rows are the four quantities most often confused for one another.
| Figure | Value | Source | Evidence |
|---|---|---|---|
| Headline market value (forecaster base) | ~$4.06B (2025) → ~$6.23B (2030) | GlobeNewswire | corroborated |
| Annual premium pool | ~$500M–$1B | Insurance Business | corroborated |
| Underwriting capacity | ~$550M–$700M / yr | New Space Economy | corroborated |
| Insured assets in orbit | ~$23B | New Space Economy (citing Elseco) | single source |
| 2023 loss ratio | ~180% — $557M premium / $995M claims | New Space Economy | corroborated |
| LEO in-orbit insurance penetration | <1% — ~300 of ~10,000 active satellites | New Space Economy | corroborated |
| Senior space underwriters worldwide | well under 100 | Copernical | single source |
Primary Sources & Research
European Space Agency (2025). Space environment health index – 2025. ESA. https://www.esa.int/ESA_Multimedia/Images/2025/10/Space_environment_health_index_2025
European Space Agency (2025). Distribution of space debris around Earth. ESA. https://www.esa.int/ESA_Multimedia/Images/2025/10/Distribution_of_space_debris_around_Earth
European Space Agency (2025). ESA Space Environment 2025 (figure 5): re-entries and disposal compliance. ESA. https://www.esa.int/ESA_Multimedia/Images/2025/04/ESA_Space_Environment_2025_figure_5
European Space Agency (2024). Zero Debris Charter goes intercontinental. ESA. https://www.esa.int/ESA_Multimedia/Images/2024/10/Zero_Debris_Charter_goes_intercontinental
European Space Agency (2024). ESA Space Environment 2024 (figure 4): conjunction events per satellite per year. ESA. https://www.esa.int/ESA_Multimedia/Images/2024/07/ESA_Space_Environment_2024_figure_4
European Space Agency / ECSL (2025). ESA/ECSL Executive Course – Space Insurance. ESA. https://www.esa.int/ESA_Multimedia/Images/2025/06/ESA_ECSL_Executive_Course_-_Space_Insurance
NASA (2025). NASA Starling and SpaceX Starlink Improve Space Traffic Coordination. NASA. https://www.nasa.gov/centers-and-facilities/ames/nasa-starling-and-spacex-starlink-improve-space-traffic-coordination/
Observer Research Foundation (2026). Megaconstellations to Strain Bharatiya Antariksh Station Operations. ORF. https://www.orfonline.org/expert-speak/megaconstellations-to-strain-bharatiya-antariksh-station-operations
East Asia Forum (2026). Starlink, China and the governance of low Earth orbit. East Asia Forum. https://eastasiaforum.org/2026/02/19/starlink-china-and-the-governance-of-low-earth-orbit/
Deloitte (2026). Next-gen satellite internet is transforming pricing, capacity, and regulation worldwide (TMT Predictions 2026). Deloitte Insights. https://www.deloitte.com/us/en/insights/industry/technology/technology-media-and-telecom-predictions/2026/next-gen-satellite-internet.html
Deloitte (2026). 2026 Global Insurance Outlook. Deloitte Insights. https://www.deloitte.com/us/en/insights/industry/financial-services/financial-services-industry-outlooks/insurance-industry-outlook.html
Chen et al. (2024). Instability of Self-Driving Satellite Mega-Constellation: From Theory to Practical Impacts on Network Lifetime and Capacity. arXiv. https://arxiv.org/abs/2406.06068
Reiland et al. (2020). Assessing and Minimizing Collisions in Satellite Mega-Constellations. arXiv. https://arxiv.org/abs/2002.00430
Gómez et al. (2022). Deterministic Conjunction Tracking in Long-term Space Debris Simulations. arXiv. https://arxiv.org/abs/2203.06957
Pinto et al. (2020). Towards Automated Satellite Conjunction Management with Bayesian Deep Learning. arXiv. https://arxiv.org/abs/2012.12450
Daoust et al. (2023). Tensor-based Space Debris Detection for Satellite Mega-constellations. arXiv. https://arxiv.org/abs/2311.11838
Ariuntugs & Madurang (2024). Optimization of Actuarial Neural Networks with Response Surface Methodology. arXiv. https://arxiv.org/abs/2410.12824
Kocifaj et al. (2021). The proliferation of space objects is a rapidly increasing source of artificial night sky brightness. arXiv. https://arxiv.org/abs/2103.17125