Key Findings
- Core space market is $420–630B (2024–2025), not $1.8T; the headline figure includes non-space “reach” applications that inflate the measurable industry by roughly two-thirds to three times its core value.
- SpaceX holds 80–85% of US orbital launch share, generates an estimated $10.4B in Starlink revenue, and is targeting a $1.5T IPO valuation that rivals the entire sector’s projected annual revenue.
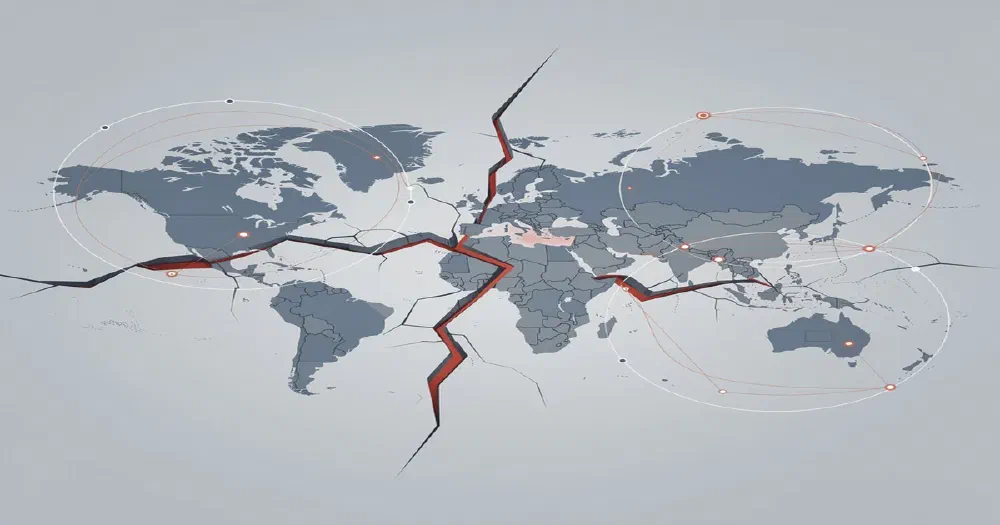
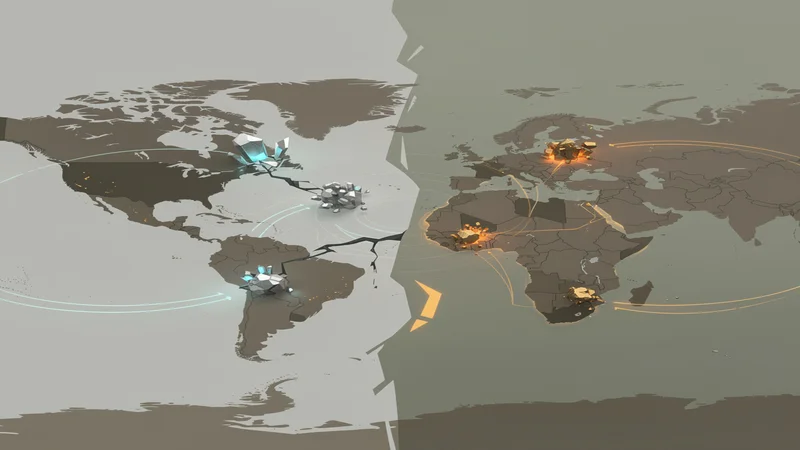
- The global space economy operates as two diverging platform ecosystems (US-led, China-led) and a declining third (Russia), with incompatible supply chains and non-fungible addressable markets.
- China’s country-targeted mineral export bans have produced a 97% drop in antimony shipments to the US and a 200% price increase, creating acute supply chain vulnerability with diversification timelines measured in years to decades.
- Government spending at $138B globally remains the structural foundation; NASA’s 24% budget cut in FY2026 is reshaping demand away from broad-based science toward concentrated exploration procurement.
Executive Summary
This analysis examines the global space economy through a dual lens of competitive forces and value chain dynamics, decomposing the frequently cited $1.8 trillion projection into its structural components. The industry is not one market but two diverging ecosystems – US-led and China-led – with a declining Russian third, each exhibiting different competitive dynamics, different fragilities, and incompatible supply chains. The central strategic insight is that headline growth metrics obscure a concentration pattern in which nearly all value capture accrues to a single vertically integrated platform operator, while the rest of the ecosystem faces a structural squeeze between high supplier power, high buyer power, and deepening dependency.

The Industry
The space economy presents a rare paradox: an industry celebrated for record growth that is simultaneously fragmenting into incompatible blocs, concentrating into a single dominant firm, and running on supply chains that have been weaponized by great-power competition. The question is not whether the headline numbers are impressive but whether they describe one market or two – and what that distinction means for everyone who is not the platform operator.
Context and Industry Definition
The global space economy, as measured by credible bottom-up methodologies, sits at $420–630B annually. Novaspace’s twelfth-edition estimate ($626B) , McKinsey’s “backbone” figure ($630B excluding reach applications) , and GlobalData’s more conservative assessment ($421B) bracket the range. The 30–50% spread across these sources is not measurement error – it reflects fundamentally different scope decisions about what counts as “space.” When McKinsey and the World Economic Forum project $1.8T by 2035, they include reach applications: companies like ride-hailing platforms that depend on satellite positioning but are not space companies by any operational definition. This is category inflation, not market growth. The analysis that follows operates on the core market, accepting the definitional uncertainty as a baseline condition rather than resolving it artificially.
The industry spans upstream manufacturing and launch, midstream in-orbit operations and ground segment, and downstream satellite services and data analytics. Government procurement is included. The geographic scope is global but decomposed explicitly into the US-led ecosystem, the China-led ecosystem, and a declining Russian segment, because treating them as one addressable market produces conclusions that apply to no actual participant.
The Competitive Landscape
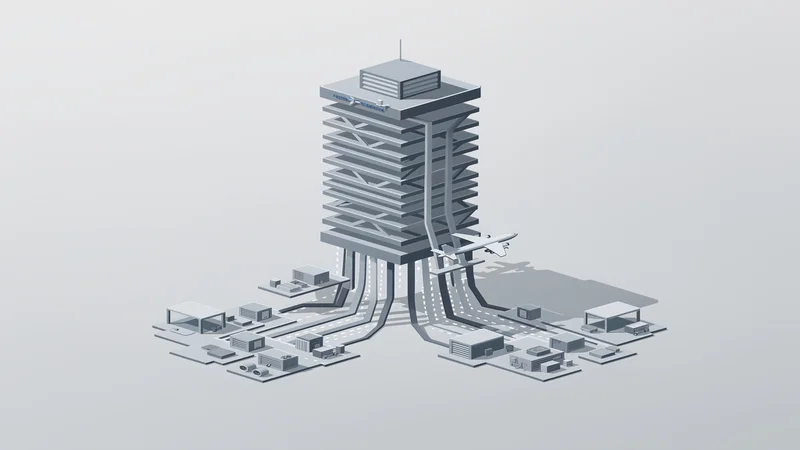
Three forces dominate the space economy’s competitive structure: supplier power, buyer power, and a form of competitive rivalry that has mutated from horizontal competition into vertical platform dominance. These forces interact in ways that make the industry moderately attractive in aggregate but structurally challenging for every participant except the one that has vertically integrated across all the chokepoints.
The supplier squeeze is acute and worsening. China controls 98% of global gallium production and has imposed country-targeted export bans on gallium, germanium, and antimony shipments to the United States. These are not theoretical risks: antimony shipments dropped 97% following restrictions imposed from September 2024 onward, and prices surged 200% . The USGS estimates a $3.4B GDP impact from gallium and germanium restrictions alone . Radiation-hardened semiconductor components depend on a small number of specialized producers, and alternative mineral sources in Australia, Canada, and Africa require years-to-decades development timelines. This force is intensifying because it is not driven by market dynamics but by geopolitical escalation – each round of export controls and entity-list designations tightens the supply constraint further .
Buyer power is equally high, concentrated in government. Global government space spending reaches $135B , with NASA ($18.8B) , the US Department of Defense, ESA, and CNSA setting the terms of engagement. This is not a market where buyers take prices; it is a market where a single budget decision can restructure entire segments. NASA’s FY2026 reorientation – exploration funding preserved, science programs gutted, STEM education eliminated – channels demand through fewer, larger programs. The new Commercial Moon and Mars Infrastructure line, growing from $864M to a projected $3.59B by 2030, concentrates government purchasing power into a procurement vehicle designed for a specific class of provider. Simultaneously, the SLS phase-out ($2.0B declining to zero by FY2029) demonstrates the government’s willingness to use its buyer power to destroy incumbent supply bases when commercial alternatives prove superior.
Competitive rivalry has transformed from traditional horizontal competition into platform-versus-ecosystem dynamics. Within the US ecosystem, SpaceX’s dominance is so thorough that the relevant competitive question is no longer “SpaceX versus other launch providers” but “SpaceX-as-platform versus everyone else.” With 80–85% of US orbital launch share, $10.4B in estimated Starlink broadband revenue, and expanding positions in government crew and cargo transportation, SpaceX has vertically integrated across the value chain’s critical nodes. The disruption cycle that began with Falcon 1 is complete: SpaceX entered as a low-cost disruptor, moved upmarket through Falcon 9, Falcon Heavy, and crew-rated vehicles, and now controls the industry’s defining chokepoint. The incumbent response – Boeing’s SLS (heading to zero), ULA’s Vulcan (arriving years after the threat became undeniable), and Arianespace’s delayed Ariane 6 – represents a textbook case of innovator’s dilemma played out at national-industrial scale.
Cross-ecosystem competition has been eliminated by policy. ITAR restrictions, entity-list designations, and critical mineral bans have severed the supply chain connections between the US-led and China-led ecosystems. China is not entering the US market from below in a disruption pattern; it is constructing a parallel platform ecosystem under state direction. CASC and CASIC serve as the state-directed orchestrators, with commercial startups like iSpace ($729M funding round) , Galactic Energy ($336M) , and LandSpace functioning as directed complementors rather than independent market entrants. The 200,000-plus satellite constellation filings – Guowang, Honghu-3, G60 – represent pre-emptive claims on orbital and frequency resources for a separate infrastructure, not competitive offerings in the existing one. Thirteen companies are queuing for domestic IPOs, eleven targeting the STAR Market , in a state-sequenced capital pipeline that bypasses normal venture discipline entirely.
The entry barrier picture is asymmetric. In the US, high capital requirements combine with SpaceX’s reusability cost advantage to make new entry in core segments extremely difficult. In China, state-backed capital substitutes for market validation, making funding barriers lower but creating a different constraint: manufacturing capacity already exceeds launch capability, making launch cadence the binding bottleneck. The substitute threat is most consequential in satellite broadband, where cumulative investment ($10B since 2019) represents just 3% of one year’s global telecom capital expenditure ($300B). Starlink’s developed-market ceiling – an estimated 3–4% maximum share based on UK penetration data – means growth must come from underserved geographies where average revenue per user is lowest.
Five Forces Summary
| Force | Intensity | Key Driver | Trend |
|---|---|---|---|
| Competitive Rivalry | High | Platform-vs-ecosystem dynamics; geopolitical segmentation | Increasing |
| Threat of New Entrants | Medium | Capital barriers + state-backed entry (China) offsetting | Stable |
| Threat of Substitutes | Medium | Terrestrial broadband caps satellite growth in core markets | Stable |
| Supplier Power | High | China critical mineral weaponization | Increasing |
| Buyer Power | High | Government budget concentration and reorientation | Increasing |
Overall Industry Attractiveness: Moderate
The Value Dynamics
The five forces paint an industry of moderate aggregate attractiveness, but aggregates are misleading. When the lens shifts to value creation and capture, a sharper picture emerges: value is migrating simultaneously along two axes – horizontally, from an integrated global supply chain toward two bifurcated systems, and vertically, from specialized component manufacturers and service providers toward the integrated platform operator that controls launch, connectivity, and government program access. Understanding who captures value, and why, is the key to separating resilient positions from vulnerable ones.
Where Value Lives
Launch is the strategic chokepoint of the current space economy. The constellation era has amplified its importance: deploying and replenishing networks of 10,000-plus satellites requires a launch cadence that only one provider (SpaceX, in the US) and potentially two to three (in China) can sustain. SpaceX’s reusability advantage compounds over time – each reuse cycle reduces marginal cost, widens the price gap against competitors, and generates reliability data that further improves performance. This creates a self-reinforcing cycle that entrenches the platform position.
Satellite broadband is the largest commercial value pool by revenue trajectory. Starlink’s estimated $10.4B revenue and 10 million-plus subscriber base make it the first space-derived consumer service to reach meaningful scale. But this segment’s value contribution must be read against its structural constraints. In developed markets, satellite broadband is additive to terrestrial infrastructure, not a replacement: the UK data showing 0.7% current penetration with a projected 3–4% ceiling suggests that revenue growth depends heavily on developing-market expansion where willingness to pay is lower. Amazon’s Kuiper constellation, backed by AWS cloud infrastructure and enterprise relationships, represents the only credible platform-level challenge to Starlink in the US ecosystem. The competitive dynamic is not about launch or broadband in isolation but about two integrated platforms – SpaceX and Amazon – competing across launch, connectivity, cloud, and data services simultaneously.
The downstream segment – satellite services, data analytics, and end-user applications – accounts for an estimated 70–75% of total market revenue but faces commoditization pressure as satellite data becomes more abundant and analytics tools proliferate. Earth observation retains moderate margins with firms like Planet, Maxar, and Airbus competing, but cloud-based ground segment services (AWS Ground Station) are compressing the infrastructure layer beneath them. Emerging sub-sectors – in-orbit servicing, space situational awareness, debris remediation – are nascent, with high growth rates but from a base too small to materially alter the ecosystem’s structure within the current decade. They represent optionality, not current value.
Investment data mirrors the market-sizing confusion. Space Capital’s $55.3B “record year” for 2025 includes a $30.2B applications layer encompassing geospatial intelligence and AI – categories that Seraphim’s narrower $8.6B venture capital figure for 2024 excludes. The fivefold divergence in investment metrics reflects the same definitional inflation that inflates the headline market figure. The claim that private investment exceeded public spending in 2024 may itself be a definitional artifact, given the degree to which private capital in both the US and Chinese ecosystems flows through government-anchored channels.
Competitive Position
The dual-lens analysis – competitive forces and value chain dynamics – converges on a single structural reality: the space economy’s headline growth narrative masks a concentration pattern in which nearly all value capture accrues to the vertically integrated platform operator.
SpaceX occupies a position that transcends traditional force categories. It has partially internalized supplier power through vertical integration, reducing its mineral dependency relative to the rest of the ecosystem (though not eliminating it). It has co-opted buyer power by becoming the default provider for NASA’s exploration reorientation. It faces no effective horizontal rivalry in US launch. And its platform position – controlling the chokepoint through which the entire upstream-to-downstream value chain flows – gives it pricing power over complementors and competitors alike. In Iansiti and Levien’s ecosystem framework, SpaceX exhibits dominator characteristics: extracting maximum value while actively expanding into adjacent segments, reducing ecosystem diversity rather than nurturing it.
For every other participant, the structural picture is considerably less favorable. Non-integrated launch providers face a dominant incumbent with a cost advantage that compounds with scale. Satellite operators depend on SpaceX for orbital access with few alternatives and high switching costs. Component manufacturers face a squeeze between mineral supply disruptions from above and vertical integration pressure from below. European actors face the question not of how to compete with SpaceX but of how to avoid complete strategic dependency.
The Chinese ecosystem presents a structurally distinct competitive picture. State direction coordinates rather than competes: capital allocation through government-backed funds, IPO sequencing through STAR Market access, and constellation deployment through centralized planning create an ecosystem where the binding constraint is physical (launch capacity) rather than financial. The competitive position of Chinese firms is strong within their ecosystem but non-transferable outside it – export controls, ITAR, and supply chain bifurcation ensure that competitiveness in one arena conveys no advantage in the other.

The Outlook
The space economy’s structure demands a strategic reorientation: away from headline growth metrics and toward resilience indicators, away from global-market assumptions and toward ecosystem-specific positioning, and away from the fiction that moderate industry attractiveness applies equally to all participants.
Strategic Implications
Industry positioning must be ecosystem-specific. Any strategy predicated on a single $626B-plus global addressable market is analytically unsound. The effective addressable market varies sharply by ecosystem: considerably smaller for any individual actor than headline figures suggest. Positioning decisions must specify which ecosystem, which segment, and which relationship to the platform operator.
Value chain focus determines survivability. Value capture is concentrating in vertically integrated platform operators at the expense of specialized, non-integrated players. For firms that are not SpaceX or Amazon, the strategic imperative is either vertical integration toward a defensible chokepoint – a segment where the platform operator has not yet established dominance – or deep specialization in a niche where switching costs and technical barriers provide protection. The emerging sub-sectors (in-orbit servicing, space situational awareness, debris remediation) offer such niches, but their nascent revenue base means they are strategic hedges, not near-term profit centers.
Resilience, not growth, is the relevant metric. The structural analysis reveals that several commonly cited growth indicators are unreliable. The $1.8T projection conflates non-comparable ecosystems and non-space applications. The private-investment crossover may be definitional. LEO broadband revenue projections systematically overweight developed-market penetration. More informative signals include: supply chain redundancy (mineral source diversification progress), customer diversification (commercial revenue as a share of total, independent of government-anchored contracts), margin sustainability under supply disruption, and orbital governance development. Monitoring priorities include SpaceX’s IPO execution and post-IPO governance , the trajectory of Chinese mineral export restrictions, NASA appropriations stability through FY2028, Starlink’s developing-market revenue per subscriber, and whether the defunding of orbital debris governance frameworks (TraCSS ) produces consequences before corrective action becomes possible.
Limitations
This analysis operates on a 2026 snapshot of an industry in phase transition. The SLS phase-out, Chinese constellation deployment, and critical mineral weaponization are all mid-process; force intensities and value chain positions are shifting faster than typical industry analysis cycles accommodate. Chinese space economy data is systematically opaque, and SpaceX financials are private and unaudited. The Five Forces framework was designed for unified markets, and its application to what is increasingly two separate ecosystems required decomposition that strains the methodology’s assumptions. Key conclusions would change materially if: SpaceX’s IPO is delayed or cancelled, China relaxes mineral export restrictions, NASA’s budget trajectory reverses, or a major orbital debris incident restructures the operating environment.
Primary Sources & Research
NASA (2025). FY 2026 President’s Budget Request Technical Supplement. NASA. https://nasa.gov/wp-content/uploads/2025/05/fy-2026-budget-technical-supplement-002.pdf
NASA (2025). NASA’s Push Toward Commercial Space Communications Gains Momentum. NASA. https://www.nasa.gov/technology/space-comms/nasas-push-toward-commercial-space-communications-gains-momentum/
NASA (2023). FY 2023 Economic Impact Report. NASA. https://nasa.gov/fy-2023-economic-impact-report
ESA (2025). Space Environment Health Index 2025. European Space Agency. https://www.esa.int/ESA_Multimedia/Images/2025/10/Space_environment_health_index_2025
NASA (2024). 2024 State-of-the-Art Small Spacecraft Technology Report. NASA S3VI. https://nasa.gov/general/2024-state-of-the-art-small-spacecraft-technology-report-is-released
CSIS (2025). The Hidden Risk of Rising U.S.-PRC Tensions: Export Control Symbiosis. Center for Strategic and International Studies. https://csis.org/analysis/hidden-risk-rising-us-prc-tensions-export-control-symbiosis
CSIS (2024). China Imposes Its Most Stringent Critical Minerals Export Restrictions Yet. Center for Strategic and International Studies. https://csis.org/analysis/china-imposes-its-most-stringent-critical-minerals-export-restrictions-yet-amidst
CSIS (2025). Beyond Rare Earths: China’s Growing Threat to Gallium Supply Chains. Center for Strategic and International Studies. https://csis.org/analysis/beyond-rare-earths-chinas-growing-threat-gallium-supply-chains
CSIS (2025). Space Threat Assessment 2025. Center for Strategic and International Studies. https://csis.org/analysis/space-threat-assessment-2025
CSIS (2025). The Commercial Space Imperative. Center for Strategic and International Studies. https://csis.org/analysis/commercial-space-imperative
Secure World Foundation (2025). A Budgetary Derailment for U.S. Leadership in Space Safety. Secure World Foundation. https://swfound.org/publications-and-reports/insight–a-budgetary-derailment-for-u-s-leadership-in-space-safety
Deloitte (2025). Delivering Space Development Growth. Deloitte Insights. https://www.deloitte.com/us/en/insights/industry/government-public-sector-services/government-trends/2025/space-industry-growth.html
Deloitte (2026). Next-Gen Satellite Internet. Deloitte TMT Predictions. https://www.deloitte.com/us/en/insights/industry/technology/technology-media-and-telecom-predictions/2026/next-gen-satellite-internet.html
Taylor, Monique (2026). Starlink, China and the Governance of Low Earth Orbit. East Asia Forum. https://eastasiaforum.org/2026/02/19/starlink-china-and-the-governance-of-low-earth-orbit/
Carnegie Endowment (2025). South Korea’s Industrial Policy for the New Space Economy. Carnegie Endowment for International Peace. https://carnegieendowment.org/research/2025/10/south-koreas-industrial-policy-for-the-new-space-economy
Xue, Patrick (2025). China’s Rare Earth Strategy May Need Recalibration. East Asia Forum. https://eastasiaforum.org/2025/11/24/chinas-rare-earth-strategy-may-need-recalibration/
Aerospace Corporation (2024). 2024 Space Safety Compendium. The Aerospace Corporation. https://aerospace.org/sites/default/files/2024-12/SSICompendiumBook_2024-12_FINAL.pdf
Fiore, F. & Elvis, M. (2025). Space Science & the Space Economy. arXiv. http://arxiv.org/abs/2502.20922v2